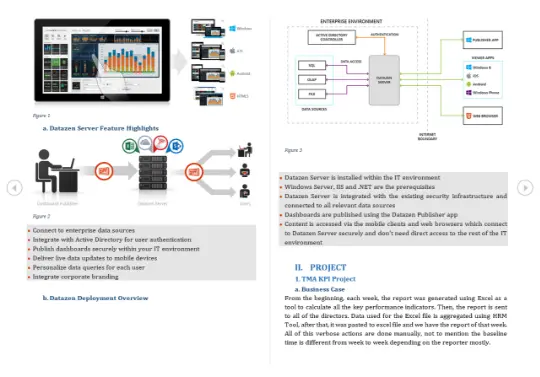
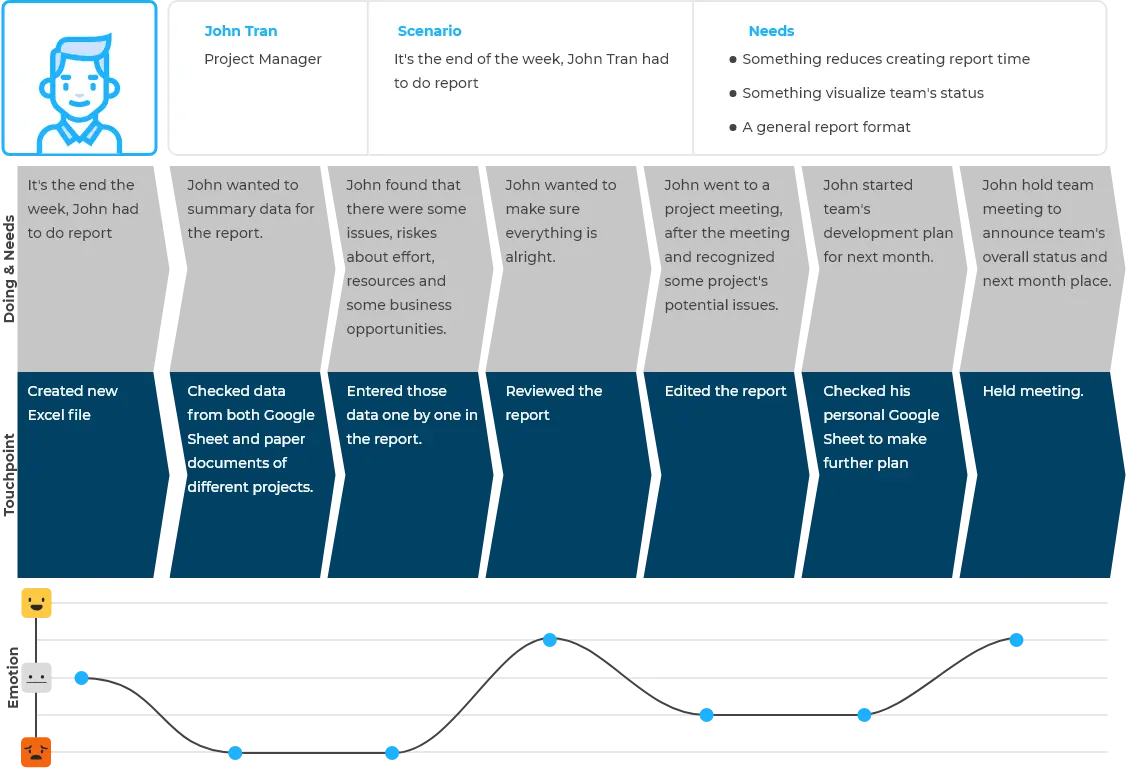
Case Study

KPI Dashboard

Issue

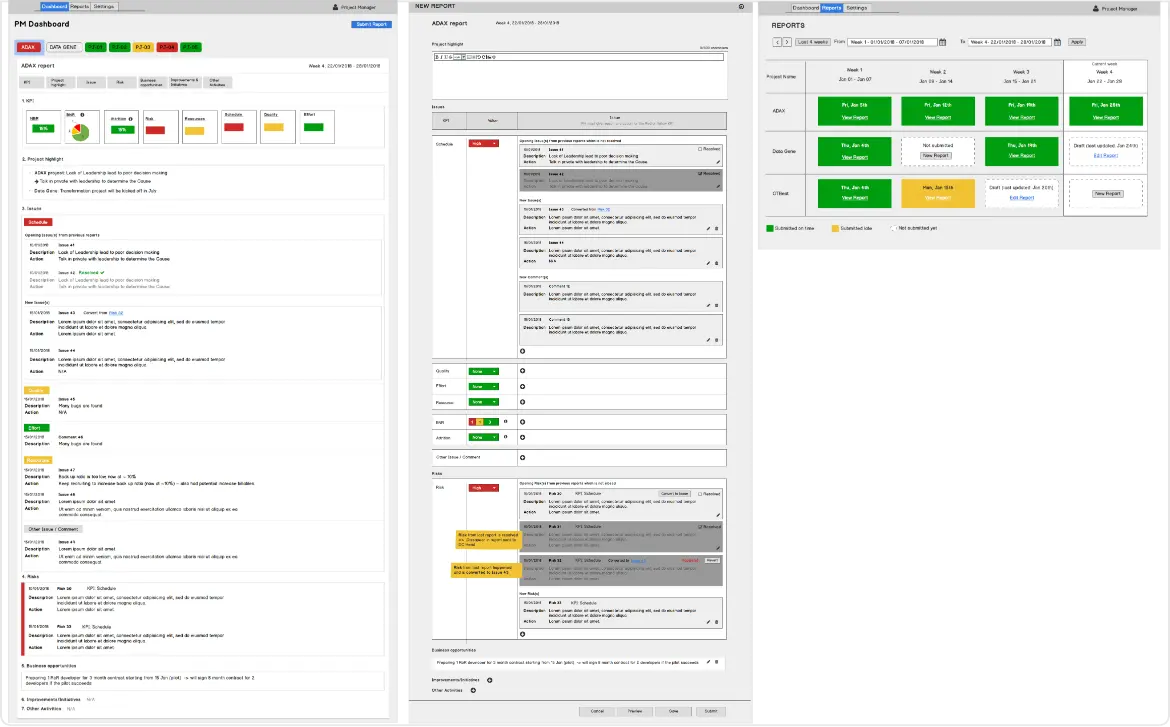
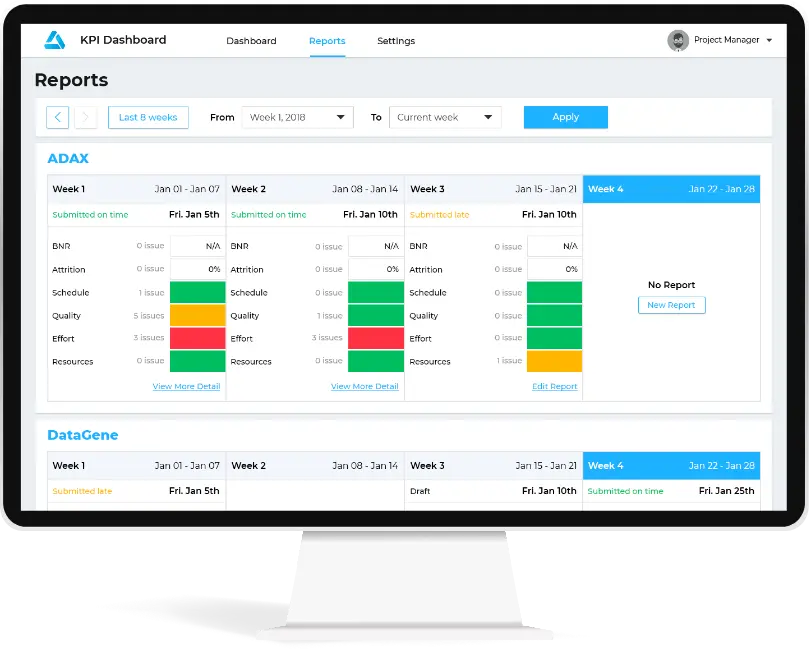
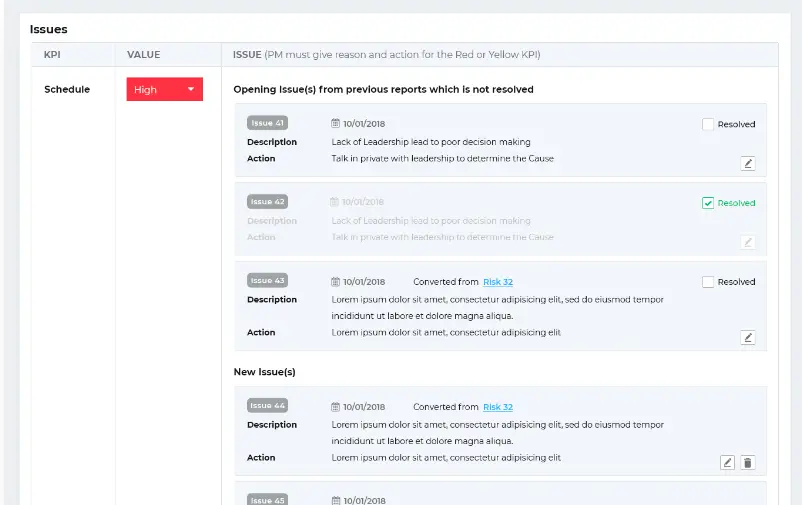
TMA's PM/SM/Director have to do reports manually in many formats. The higher level the manager are the higher difficulties they face when collect all data from lower level manager's reports.
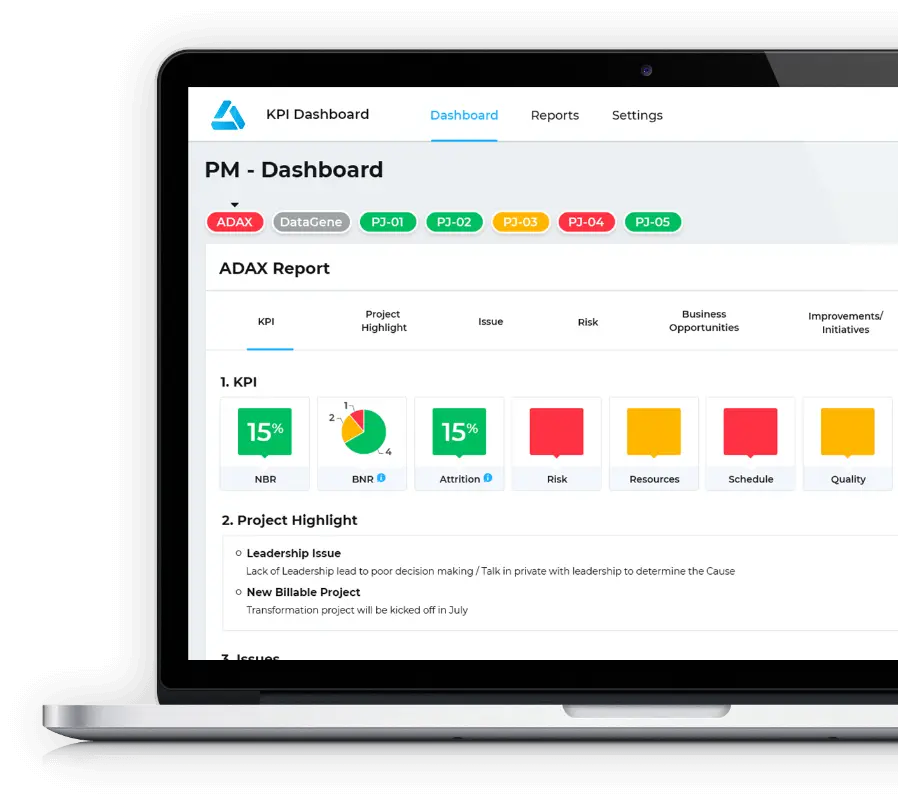
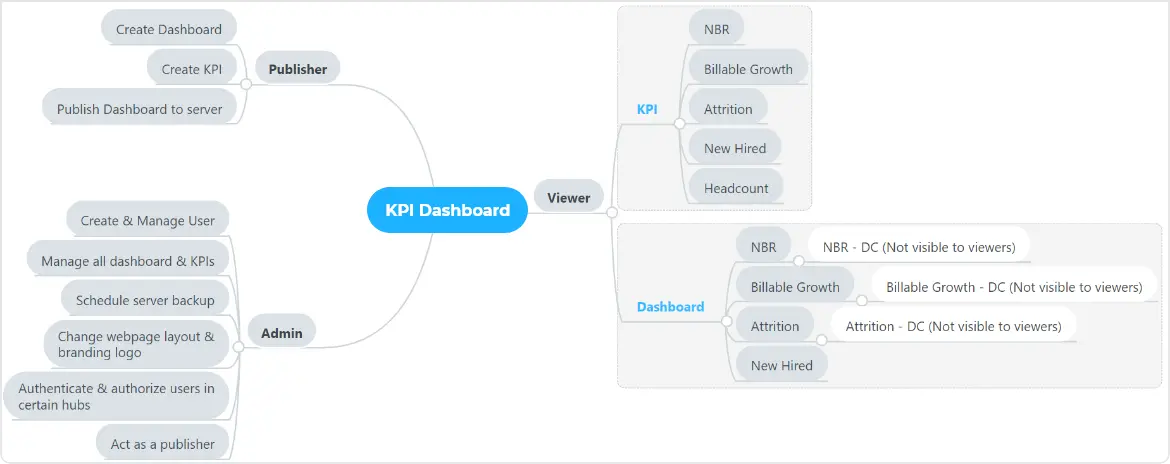
Solution

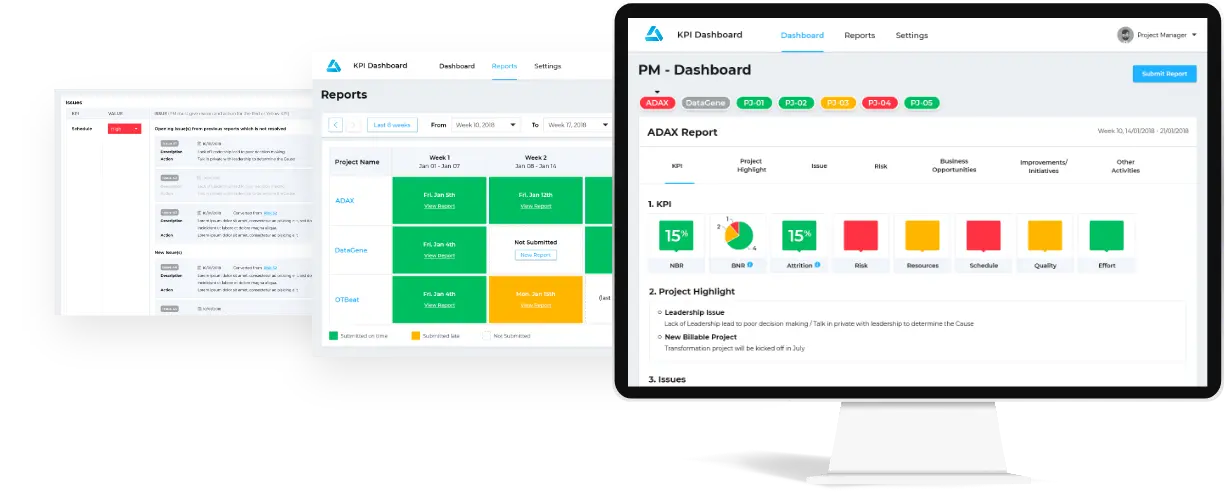
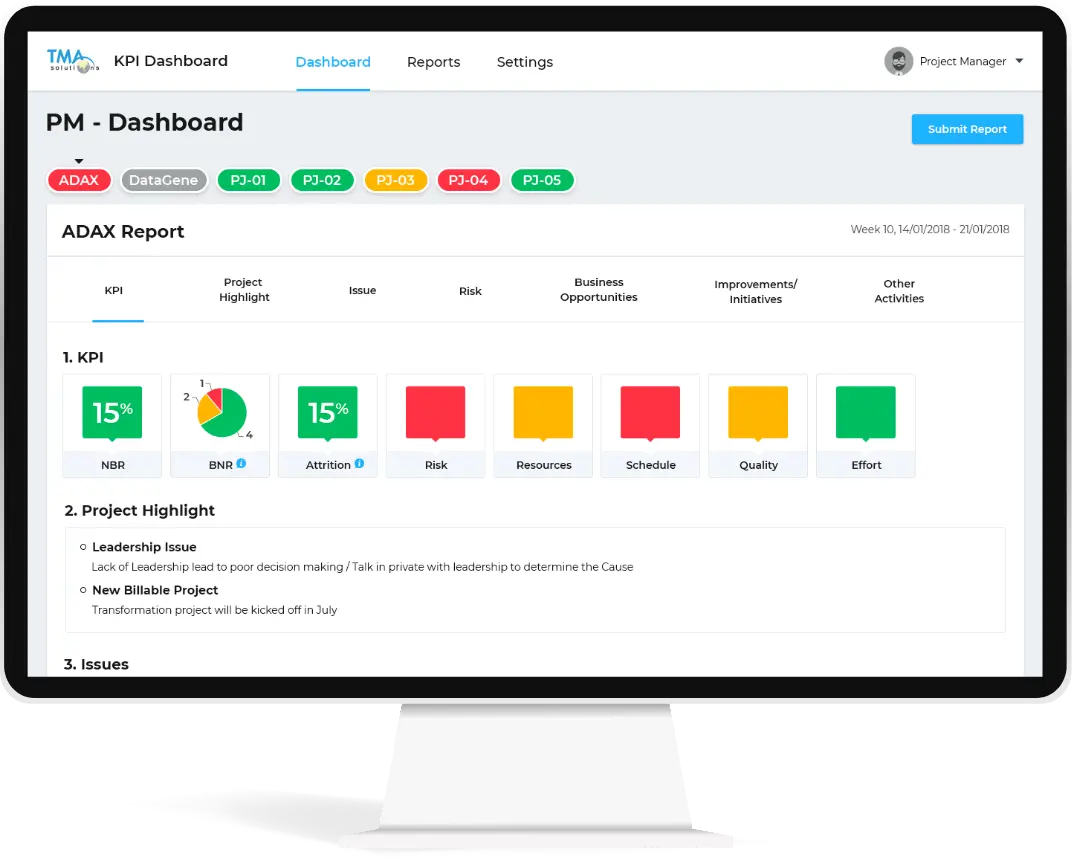
KPI Dashboard is a project with the purpose of aggregating and visualizing TMA weekly KPIs for BOD and managers. It replaces the old fashion way which was done using Excel and human effort. Now everything is automatic, data is presented on charts and dashboards in a much more beautiful way, which takes less human effort than before.

kpi dashboard images

What we did

Learn about the characteristics of business and target users, and come up with a design solution that helps them achieve their goals.

light
1. Strategy

Focus on information gathering and product orientation and understand: business goal, user need.

Action:
  • Create Detail Business Requirement
Output:
  • BRD
research-and-analysis-icon icon
2. Research & Analysis

In this phase, we focus on research and analyze Project Manager, who is target user.

Action:
  • Interview User
  • Define User Center Business Canvas, Target User Personas, User Journey Map
Output:
  • User Center Business Canvas
  • Target User Personas
  • User Journey Map
ux-design icon
3. UX Design

Focus on designing solutions that solve target user and business problems and help them achieve their goals.

Action:
  • Define Feature List & Flow
  • Design Wireframe
Output:
  • Function Map
  • Work Flow
  • Feature List
  • Wireframe
ui-design icon
4. UI Design

Craft beautiful appealing design to create the look and feel of the application and comply with the solutions dicovered in UX Design.

Action:
  • Identify Brand Personality Traits
  • Design UI
  • Create Prototype
Output:
  • Spectrum Of Brand Personality Traits
  • Design Inception Worksheet
  • Moodboard / Typeface / Color Palette
  • User Interface / Prototype
ui-design icon
5. UX Testing

Test and validate the design with target user to uncover issues. Summary into a testing report that baseline for further update.

Action:
  • Prepare/ Conduct User Interview
  • Collect & Analyze Findings from Interview
Output:
  • Interview Script
  • Interview Checklist
  • Finding List
update-design icon
6. Update Design

Update wireframe and UI based on the information collected from the UX Testing.

Action:
  • Update Wireframe
  • Update UI
Output:
  • Updated Wireframe
  • Updated UI

1. Strategy

Focus on information gathering and product orientation and understand: business goal and user need.

Create Detail Business Requirement
Stakeholders
  • avatar
    Client
  • avatar
    Business Analyst
  • avatar
    UX Researcher
  • avatar
    UX/UI Designer
  • avatar
    Development Team
Tasks
  • Meeting and communicating with all Stakeholders of the Project to finalize detailed requirement.
Outputs

BA was in charge of creating Business Requirement Document.

business requirement

2. Research & Analysis

In this phase, we focus on research and analyze Project Manager, who is target user to find out their characteristics.

Interview User
Stakeholders
  • avatar
    Client
  • avatar
    Business Analyst
  • avatar
    UX Researcher
  • avatar
    UX/UI Designer
  • avatar
    Development Team
Tasks
  • Compose Question list about User Type 1 - Project Manager.
  • Contact & set up meeting with Participants.
  • Compose checklist for an Interview.
Outputs

UX Researcher was in charge of conducting User Interview.

Persona Question list
  • Which tool do you usually use to manage the project progress?
  • How much time per day do you spend on working?
  • Which tool do you use to make a report?
  • How much time does it take to use that tool?
  • Do you find it difficult to scan information among too many columns?
  • Which way do you use to update the project situation?
  • Is your report format created by predecessor or yourself?
  • How many people do you have to send the report to?
  • Are the reports done once or at different times?
  • How often do you make a report?
  • When do you oftent make the report? (close to the day, a few days before the deadline)
  • Do you receive a report from another partner or report it yourself?
  • Do you review the old report, if so, when?
  • Do you often make plan for team?
  • Where do you usually save the data used for reporting?
  • Have you ever been missing data in the report?
  • If not, when you submit the report, are you afraid of missing data?
  • If you miss / give wrong data, how could you handle it?
Interview Checklist
Preparation
Task
  • Call and confirm who can participate:
    • - Participant 1 (3h 30/01/2019)
    • - Participant 2 (10h 31/01/2019)
    • - Participant 3 (11h 30/01/2019)
  • Book room to do interviews
Devices
  • 1 Laptop (for note-taker)
  • 1 Smartphone (for recording)
  • Tripod (for recording)
  • Microphone (for recording)
  • Hard copy of Question List
Before the Interview
Task
  • Check the internet/wifi
  • Setting Camera
  • Create a project report for nearst week (setup data for user)
  • Run Camtasia
  • Check mircrophone
  • Open laptop access to KPI Dashboard Document link to take note
After the Interview
Task
  • Check the camera as well as the quality of the videos
  • Clean up the meeting room
  • Summarize the data collected in the meeting
Collect & Analyze Findings from Interview
Stakeholders
  • avatar
    Client
  • avatar
    Business Analyst
  • avatar
    UX Researcher
  • avatar
    UX/UI Designer
  • avatar
    Development Team
Tasks
  • Collect & Analyze Findings from Interview.
Outputs

UX Researcher was in charge of collecting & analyzing Data from all interview records.

Finding List - User Type 1 - Project Manager
Statements
Participant 1
Participant 2
Participant 3
1.
All participants are using Microsoft Excel or Microsoft Powerpoint to report to higher-level managers.
One of three participants is using Google Sheet to update data real-time to his higher-level manager.
04:50 - 05:53
01:27 - 02:03
01:16 - 01:24
2.
Two of three participants said that they do report by their current tool very quickly because all necessary data were collected before in their private Excel file.
One of three does not really take time to do report since he update it realtime to his higher-level manager as mentioned in Finding #1. His lower-level employees also update realtime to his private Google Sheet
00:55 - 02:35
02:21 - 02:29

01:25 - 01:40

05:51 - 06:24

09:38 - 09:49

3.
One of three participants have to report to two difference higher-level managers because his projects belongs to two difference DCs.
02:02 - 02:20
4.
Two of three participants said that the format of the Report could be defined by Project Manager themselves or depend on the higher-level manager.
02:49 - 03:07
03:43 - 04:56
5.
All participants do Report in difference time of the week.
Participant 1, as mentioned in Finding #1, almost do report everyday, not at a specific time of the week.
04:53 - 06:02
03:39 - 03:51
08:12 - 08:19
6.
Two of three participants rarely review old Reports.
36:29 - 36:47
05:26 - 05:40
7.
All participants sometimes miss some data in the Reports. Sometimes it is their faults, sometimes it is their lower-level employees’ faults.
06:09 - 06:21
05:18 - 06:05

07:22 - 07:49

13:22 - 13:53

8.
One of three participants thought that most higher-level managers usually skim Report if it is Green and only seek for details when there is Red or Yellow.

17:40 - 17: 56

20:55 - 21:04

Define UCBC, Target User Personas, User Journey Map
Stakeholders
  • avatar
    Client
  • avatar
    Business Analyst
  • avatar
    UX Researcher
  • avatar
    UX/UI Designer
  • avatar
    Development Team
Tasks
  • Define User Centered Business Canvas, Target User Personas, User Journey Map based on user interview's results.
Outputs

UX Researcher was in charge of creating User Research Document.

User-Centered Business Canvas
The Problem
The User
The Product
Problems, Needs
  • Something reduces creating report time
  • Something helps me finding old report quickly
  • Something displays report in a easier-to-read format
Users
  • PM, SM, DC Head, DG Head, PMO, CEO of TMA Solution
User Fears
  • Spending too much time on creating report
  • Reports are complex to read
  • Awakening issue too late
  • Spending too much time on finding an old report
  • Miss importance metrics, events
Solution
  • Provides TMA's standard format of report, they just need to input data
  • Auto summary their staff reports
  • Better UI that provides better readability
Acquisition Channels
  • Internal employee of TMA Solution Company.
Existing Solution
  • Use Excel, Power Point to record necessary data and create report
Early Adopters
  • PM, SM, DC Head, DG Head, PMO, CEO of TMA Solution
User Goals
  • Save time for report
  • Catch/Raise company/project issue/risk as soon as possible
  • Quickly catch up company overall status in realtime
  • Easy to find old report
Value Proposition
  • Quickly create and read report
  • Quickly catchup company status
  • Display report in a more intuitive layout
Revenue Sources
  • None
Metrics
  • Amount of negative feedback
  • Time for comprehending and creating report


User Personas
Type 1 - Project Manager
project manager
John Tran
Project Manager
Demographic
  • Age: 34
  • Status: Married
  • Familiar with Microsoft Word, Excel, Trello,...
  • Technical level: high
  • Busy
Problems
  • Each project has various type of formats
  • Miss data sometime
Needs
  • Something reduces creating report time
  • Something visualize team's status
  • A general report format
Context
  • Do report weekly/monthly
  • Note team's status in Excel
  • Do report by Excel
  • Mange many projects at the same time
  • Hold team meeting daily/weekly/monthly to update status
Type 2 - DC Head
dc head
David Nguyen
DC Head
Demographic
  • Age: 40
  • Status: Married
  • Familiar with Microsoft Word, Excel, Trello,...
  • Technical level: high
  • Busy, careful, hard working
Problems
  • Spend too much time on creating report
  • Spend too much time on finding an old report
  • Do multi tasks at the same time
  • Hard to scan too much data in report from different PMs
  • Use too much color
Needs
  • Something reduces creating report time
  • Something helps me finding old report quickly
  • Easier way to scan report data
Context
  • Do report monthly
  • Usually busy
  • Mange many PMs at the same time
  • Hold DG meeting weekly/monthly to update status
  • Note DG's status in excel and paper document
Type 3 - PMO
pmo
Elly Pham
PMO
Demographic
  • Age: 56
  • Status: Married
  • Familiar with Microsoft Word, Excel, Trello,...
  • Technical level: high
  • Very busy, careful, disciplined, hard working
Problems
  • Don't have much time to read reports
  • The information displayed in app are not clear enough to scan
Needs
  • Something that help to scan information more quickly and easily
Context
  • Usually busy
  • Manage many Center at the same time
  • Hold monthly meeting with each Centers
  • Note DG's status in excel and paper document
  • Need to summary report from lower level manager then submit to Chu Le
  • Meet clients
User Journey Map

3. UX Design

Focus on designing solutions that solve target user and business problems and help them achieve their goals.

Define Feature List & Flow
Stakeholders
  • avatar
    Client
  • avatar
    Business Analyst
  • avatar
    UX Researcher
  • avatar
    UX/UI Designer
  • avatar
    Development Team
Tasks
  • Create Function Map
  • Create Work Flow
  • Create Feature List
Outputs

Business Analyst was in charge of creating Feature List.

Function Map
function map
Work Flow
function map
Feature List
Module
Function
Sub-function
Authentication
Login
Logout
Forgot Password
Change Password
Dashboard
View Dashboard (Adjusted for each role)
View by week (2 latest weeks)
Filter by project
Filter by DC
View Billable Growth of whole company and each DG
View Project's Report
View by week (2 latest weeks)
Timeline
View Timeline
View by 8 current weeks range
View by 8 custom weeks range
Filter by project
TMA Timeline
View TMA Timeline
View by 8 current weeks range
View by 8 custom weeks range
Filter by DG, DC
Report
Create report
CRUD Issue
CRUD Risk
CRUD Comment
CRUD Business Opportunities
CRUD Improvements/Initiatives
CRUD Other Activities
Save report
Preview mode
View report
View by 8 current weeks range
View by 8 custom weeks range
View report
View report
Project Dashboard
View Project Dashboard
View by current view
View by custom week
Help
View tutorial
Feedback
Create and send feedback
Design Wireframe
Stakeholders
  • avatar
    Client
  • avatar
    Business Analyst
  • avatar
    UX Researcher
  • avatar
    UX/UI Designer
  • avatar
    Development Team
Tasks
  • Brainstorm solutions then design Wireframe based on collected data
Outputs

UX Designer was in charge of designing Wireframe.

Wireframe
wireframe design

4. UI Design

Craft beautiful appealing design to create the look and feel of the application and comply with the solutions discovered in UX Design.

Identify Brand Personality Traits
Stakeholders
  • avatar
    Client
  • avatar
    Business Analyst
  • avatar
    UX Researcher
  • avatar
    UX/UI Designer
  • avatar
    Development Team
Tasks
  • Design UI Concept
Outputs

UI Designer was in charge of identifying Brand Personality Traits.

Spectrum of Brand Personality Traits
Adjectives for concept and style from personality traits that we got from Client
Brand Personality Traits
Design Inception Worksheet
Design Inception Worksheet will define the criteria that we need to consider when deciding the design elements

Client's Expectation:

Based on all Adjectives we have from Customer’s Expectation and Selected Moods from Spectrum of Brand Personality Traits, we can define 6 elements (Color, Typeface, Texture, Movement, Shape, Space) for the Interface Design.

Visual language
moodboard

MOODBOARD

moodboardmoodboard

TYPEFACE

Montserrat Regular
ABCČĆDĐEFGHIJKLMNOPQRSŠTUVWXYZŽabcčćdđefghijklmnopqrsštuvwxyzžАБВГҐДЂЕЁЄЖЗЅИІЇЙЈКЛЉМНЊОПРСТЋУЎФХЦЧЏШЩЪЫЬЭЮЯабвгґдђеёєжзѕиіїйјклљмнњопрстћуўфхцчџшщъыьэюяĂÂÊÔƠƯăâêôơư1234567890‘?’“!”(%)[#]{@}/&\<-+÷×=>®©$€£¥¢:;,.*
Montserrat Medium
ABCČĆDĐEFGHIJKLMNOPQRSŠTUVWXYZŽabcčćdđefghijklmnopqrsštuvwxyzžАБВГҐДЂЕЁЄЖЗЅИІЇЙЈКЛЉМНЊОПРСТЋУЎФХЦЧЏШЩЪЫЬЭЮЯабвгґдђеёєжзѕиіїйјклљмнњопрстћуўфхцчџшщъыьэюяĂÂÊÔƠƯăâêôơư1234567890‘?’“!”(%)[#]{'{@}'}/&\<-+÷×=>®©$€£¥¢:;,.*
Montserrat Bold
ABCČĆDĐEFGHIJKLMNOPQRSŠTUVWXYZŽabcčćdđefghijklmnopqrsštuvwxyzžАБВГҐДЂЕЁЄЖЗЅИІЇЙЈКЛЉМНЊОПРСТЋУЎФХЦЧЏШЩЪЫЬЭЮЯабвгґдђеёєжзѕиіїйјклљмнњопрстћуўфхцчџшщъыьэюяĂÂÊÔƠƯăâêôơư1234567890‘?’“!”(%)[#]{'{@}'}/&\<-+÷×=>®©$€£¥¢:;,.*

COLOR PALETTE

screenshot
Create Prototype
Stakeholders
  • avatar
    Client
  • avatar
    Business Analyst
  • avatar
    UX Researcher
  • avatar
    UX/UI Designer
  • avatar
    Development Team
Tasks
  • Prepare prototype for next step UX Testing
Outputs

Development Team was in charge of creating Prototype.

create prototype

5. UX Testing

Test and validate the design with target user to uncover issues. Summary into a testing report that baseline for further update.

Prepare / Conduct User Interview
Stakeholders
  • avatar
    Client
  • avatar
    Business Analyst
  • avatar
    UX Researcher
  • avatar
    UX/UI Designer
  • avatar
    Development Team
Tasks
  • Compose Interview Script for User Type 1 - Project Manager.
  • Contact & set up meeting with Participants.
  • Compose checklist for an Interview.
Outputs

UX Researcher was in charge of conducting User Interview.

Interview Script - User Type 1 - Project Manager
Purpose
Test out the need, usuability, understanding of current version.
Scope
Test on desktop web.
Focus on Dashboard, Report Timeline, Create Report
Onboarding
Warm up
Brief introduce the project
- What's your name?
Thank for coming here today to join this Interview. KPI Dashboard is {brief introduction}.
- How long have you worked here?
We will record everything happens in this interview in order to serve the research and development. All of your information is secured and will never be published.
Scenario #1
Name
Read Report Home Screen
Scenario
Once a week, you have to report to your Senior Manager, but first let's try to read report home screen.
Task/Question
Do you know what each color in each section means?
Overall Experience

- Is the Report Home Screen helpful for you or you can use it in any purpose?

- Do you face any difficulty during using it?

- Does the display of "Create Report Home Screen" help you to scan information easily?

- Do you want to add/remove any section in Creating Report Homescreen part?

Scenario #2
Name
Create Report
Scenario
Once a week, you have to border-left-1report to your Senior Manager, let's try to create report using KPI Dasboard.
Task/Question

Try to access to create report page

Do you know what need to be filled in each field?

Do you know what each color (Red, Yellow, Green) in each section means?

Suppose that there were issues/risks happens to your project, let's add 3 issues

Suppose that you want to add a comment to Effort section, let's add a comment

Suppose that your last week risk become this week issue, what will you do?

Suppose that you want to report issues that have already resolved, let's resolve an issue

Suppose that you accidenly make a mistake when adding the issue, try deleting that issue

Suppose that you accidently make a mistake when adding the issue, try editing that issue

Suppose you want to preview your report before submitting, try to access "Preview Mode"

Overall Experience

- Is the Preview mode helpful for you or you can use it in any purpose?

- Do you face any difficulty during creating report?

- Does the display of "Create Report" help you to scan information easily?

- Do you want to add/remove any section in Creating Report part?

Scenario #3
Name
Edit Report
Scenario
You find that you made a mistake in Week [...] Report, now you want to edit it and resubmit.
Task/Question
Let edit Week [...] report
Overall Experience
- Do you feel it's easy for you to access to edit report page?
Scenario #4
Name
Read Dashboard
Scenario
Once a week, you read Dashboard to catch up project's status.
Task/Question

Can you understand what are being displayed on dashboard?

Suppose that you want to view report of [Project Name], what will you do?

Overall Experience

- Are dashboard's data helpful for you or you can use it for any purpose?

- Take a look at dashboard, is it easy for you to find out which project got risks/issues?

- If not, please tell us which information you need?

- If an project has issue/risk, does the report gives you enough information?

- Are there any else data that you need in the dashboard?

- Are there any data in the report are not neccessary for you?

- Does the display of "Dashboard" help you to scan information easily?

- Do you want to add/remove any function in Dashboard?

- Is there any important data you need to display first?

Interview Checklist
Preparation
Task
  • Call and confirm who can participate:
    • - Participant 1 (3h 30/01/2019)
    • - Participant 2 (10h 31/01/2019)
    • - Participant 3 (11h 30/01/2019)
  • Book room to do interviews
Task
  • 1 Laptop (for note-taker)
  • 1 Smartphone (for recording)
  • Tripod (for recording)
  • Microphone (for recording)
  • Hard copy of Question List
Before the Interview
Task
  • Check the internet/wifi
  • Setting Camera
  • Create a project report for nearst week (setup data for user)
  • Run Camtasia
  • Check mircrophone
  • Open laptop access to KPI Dashboard Document link to take note
After the Interview
Task
  • Check the camera as well as the quality of the videos
  • Clean up the meeting room
  • Summarize the data collected in the meeting
Collect & Analyze Findings from Interview
Stakeholders
  • avatar
    Client
  • avatar
    Business Analyst
  • avatar
    UX Researcher
  • avatar
    UX/UI Designer
  • avatar
    Development Team
Tasks
  • Analysis data from user interview section
Outputs

UX Researcher was in charge of collecting & analyzing Data from all records of the Interview.

Finding List - User Type 1 - Project Manager
In this interview, we discovered 42 findings in total. In this Case Study, we only introduce a few Findings.
Finding
Report Timeline
P. 1
P. 2
P. 3
Recommendation
Comprehen-sion
1.
All participants misunderstood meaning of each status in the Calendar. One thought that Draft means a Report was submitted. One could not distinguish the meaning
15:30 - 16:40
06:30 - 06:40
15:05 - 15:22
  • Re-design visual for each status in Report General screen to avoid misunderstanding.
2.
One of three participants said he does not find the summary information displayed here is useful.
13:57 - 14:36
  • Consider what information should be displayed here.
Usability
3.
All participants found it difficult to switch Time Range.
20:06 - 21:15
36:57 - 37:17
23:08 - 23:59
25:53 - 26:04
16:01 - 16:59
  • Re-design this feature to make it become more familiar to style of popular tools.
Other
4.
One of three participants said he is managing 3 projects which belongs to one customer. However, KPI Dashboard display Projects data following the customer’s name, he cannot do report for each project he managing.
  • Re-define structure of data with project team.
5.
One of three participants said there is a case that a project belongs to a customer living in different timezone. This can cause problem for Project Manager who has to work follow customer’s timezone.
17:10 - 19:06
  • Re-define structure of data with project team.
Create Report
Comprehen-sion
6.
Two of three participants thought they can input these data by themselves.
Three Participants misunderstanding these data meaning.
24:37 - 24:56
10:35 - 11:04
18:00 - 18:10
30:26 - 30:55
18:23 - 18:42
19:26 - 19:39
19:56 - 21:32
- Adjust UI of these parts to make clear that they are automatically generated.
- Add tooltip to each part.
7.
Two of three participants confuse about the difference between meaning of Risk & Issue.
13:15 - 13:19
26:16 - 27:32
- Add description or tooltip to Risk section.
Usability
8.
One of three participants wants to clarify the color for each issue instead of one color is applied to all issues of a section.
Another participants said it is not necessary to set status color for each issue.
28:34 - 28:50
16:35 - 16:58
- Keep the status color of each section but add feature apply status color to each issue. Also adjust how it will be display on Dashboard.
9.
One of three participants did not realise the changes when Resolved checkbox is checked.
Another participant even did not realise that there is Resolved checkbox.
27:04 - 27:13
23:27 - 24:05
- Emphasize visual changes when an Issue is marked Resolved.
Other
10.
Two of three participants thought that it would take the same amount of time to do report by KPI Dashboard.
One of the two even said KPI Dashboard might take more time than his current tool because it is too many step to Add a New Issue.
37:25 - 38:36
45:05 - 45:28
- Adjust behavior design for Adding New Issue / Comment / Risk.
11.
One of three participants said that he needs to see the general view of Issue first. He will see Issue’s details only if necessary. The current layout design is wasting too much space.
32:50 - 33:33
- Re-design layout to help user see more item in one screen.

6. Update Design

Update wireframe and UI based on the information collected from the UX Testing

Update Achitecture Design & UI Design
Stakeholders
  • avatar
    Client
  • avatar
    Business Analyst
  • avatar
    UX Researcher
  • avatar
    UX/UI Designer
  • avatar
    Development Team
Tasks
  • Update Wireframe
  • Update UI
Outputs

UX Designer & UI Designer were in charge of updating Architecture Design & UI Design.

BEFORE

Update design
Update design

AFTER

Update design
Update design
Update design
Update design
Scroll to top